06. January 2023
Uncovering the Limitations of Amazon EC2 Burstable Instances
Nowadays, cloud computing is a mature, widely established model to efficiently develop and operate applications at scale. Despite this, the limitations that lurk beneath cloud vendor abstractions can still easily take engineers by surprise. Learn from my experience and avoid the pitfalls I recently encountered working with the Amazon EC2 burstable instance model.
Project background
I joined a product development team to help them increase the capacity and observability of their B2B e-commerce application. The aim was to make the system resilient against an anticipated peak traffic season looming ever closer.
The tech stack comprised two PHP web applications running on a small cluster of Amazon EC2 instances distributed across two environments, namely:
- Development:
dev-1,dev-2anddev-3 - Production:
prod-1,prod-2andprod-3
We had just added several alerts and dashboards to Datadog, our centralised application monitoring platform. The configuration of the alerts was mirrored across both environments to obtain early warning of concerning trends in Development before they had the chance to emerge in Production.
A busy server
The team set up an alarm to monitor CPU utilisation for all the EC2 instances in the platform. The alarm would trigger if CPU consumption remained higher than 60% on average for a few minutes. Sometime later, this notification appeared in our non-production alerts channel.
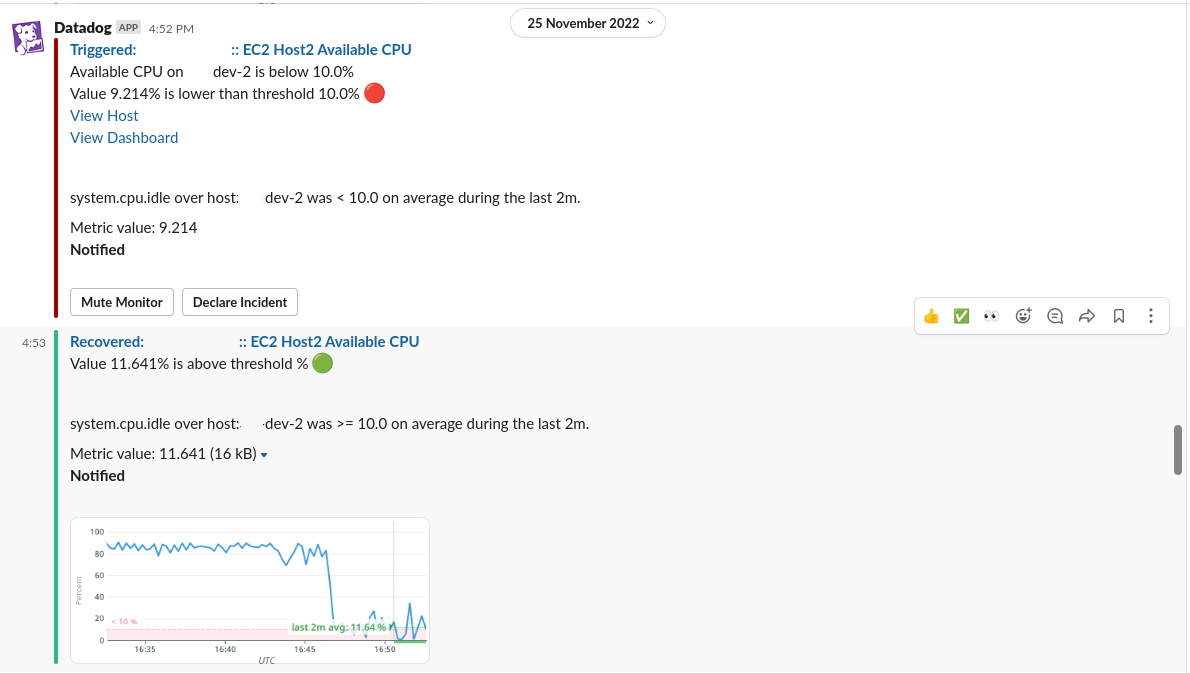
There are an array of reasons why available CPU capacity can dip dramatically for a short period in a development server, even if the server is typically quiet:
- Someone running ad-hoc tests on the box
- An expensive, scheduled process or web request
- A large system update
The first time this happened we didn’t put much effort into discerning the underlying cause. We used the above mundane reasons to explain the problem away and moved on to more pressing matters. However, this wasn’t the last we’d see of this alert.
The mysterious spike strikes again
Following this first instance, it wasn’t long before the high CPU utilisation alarms for dev-2 became a regular occurrence.
We could no longer dismiss this as a transient issue so we decided to look closer at the problem. Sure, testing in the environment could increase the workload on the instance but not to the extreme levels our alerts were showing. What was even weirder is that dev-1 or dev-3 were not suffering from the same problem! Nonetheless, there were a few obvious explanations we could rule out to narrow things down.
A denial-of-service attack
Our system had recently become the target of a few low-scale DDoS attacks. Crawlers and bots, both benign and malicious, probe our public endpoints routinely for weaknesses so this explanation didn’t sound far-fetched at all. However, neither our quiet traffic gauges nor the uninteresting makeup of our incoming HTTP requests backed up this hypothesis.
The instance was genuinely busy dealing with legitimate traffic
One peculiarity of dev-2 was that it was the only instance in the Development cluster that processed messages from our application queues, which could explain why its resource utilisation graphs looked busier than the other two. There again, worker thread concurrency was set to 1 and the message processing activities weren’t particularly taxing. We didn’t see an uptick in incoming HTTP requests or any kind of heavy transactions that could drive up compute this much either so we weren’t satisfied we had found the problem yet.
Once we had ruled out most simple explanations, we began considering giving up and launching a new instance to replace the poorly performing dev-2, writing off the issue as server misconfiguration or data corruption. While it is common practice to destroy servers in the cloud to squash bizarre, localised problems, I was slightly concerned the same issue might eventually reoccur in a different Development instance or worse, in Production. To assuage my worries, I took one final look at the detailed CPU usage breakdown metrics Datadog exposes about the hosts it monitors.
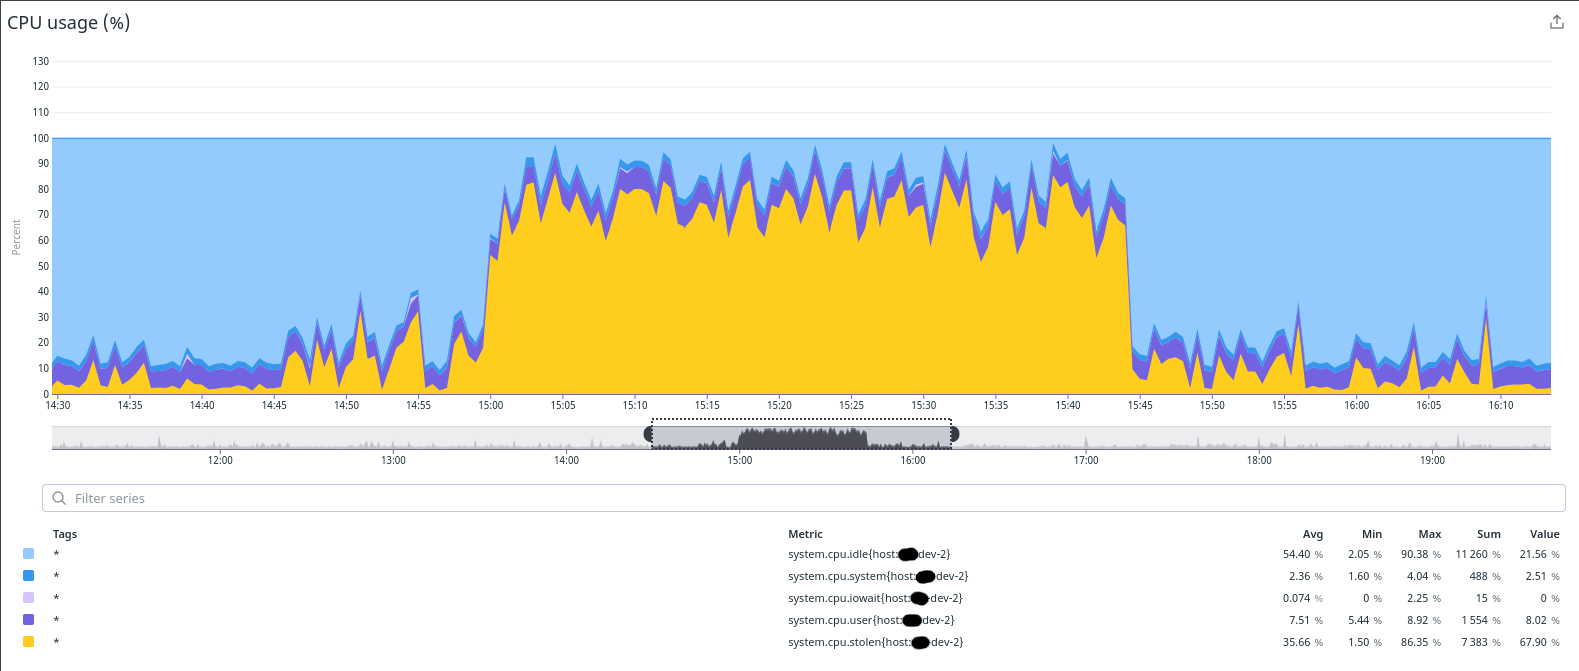
The metric system.cpu.stolen (in yellow) immediately drew my attention as it was shown as the single biggest contributor to the high CPU figures we were registering. But what is system.cpu.stolen exactly? Who’s stealing our CPUs from us, and why would they do that?
The breakthrough
The Datadog documentation explains that the system.cpu.stolen metric measures the number of CPU cycles that the hypervisor steals from one of its guest virtual machines (VM). When a VM hypervisor steals cycles from a guest VM, it suspends or throttles the VM’s CPU resources to reallocate them to a different VM in the cluster it manages. In the vast scale of the public cloud, this rebalancing occurs to mitigate hardware constraints at the data centre; it is the way hypervisors ensure fair distribution of their finite physical resources.
Another important thing to note at this point is that every EC2 provisioned in both our Development and Production environments was a t3.micro, a low-cost, 3rd generation burstable instance type. What makes burstable instances different to other general-purpose compute offerings in EC2 is that they’re cheaper and, critically, that they are expected to operate on a low CPU utilisation baseline most of the time. They are capable of automatically increasing (bursting) their base compute capacity in response to a spike in demand, although they will not keep this up for too long (for the same price, that is).
The amount of time a burstable instance can exceed its nominal performance levels is defined by its allotted CPU credits, specified in this table. A t3.micro has a 10% CPU utilisation baseline and accrues 12 credits per hour as long as CPU usage remains below that cap. If the instance exceeds this threshold, it will start consuming burst credits. What happens to the instance when all of its burst credits are depleted depends on its credit specification:
- Standard: consumes accrued credits to burst beyond its baseline capacity. Once all burst credits are used up, the CPU will be gradually throttled back down to match its baseline.
- Unlimited: the instance is never throttled, even if all of its credits are drained. Instead,
Unlimitedburst instances consume surplus credits, an additional type of burst currency specific to this specification which incurs additional fees for every hour it continues to run above its baseline.
Now that we knew all of this, I was able to piece together a very strong hypothesis that dev-2 had been routinely exceeding its low compute baseline, depleting all of its burst credits and ending up throttled by AWS.
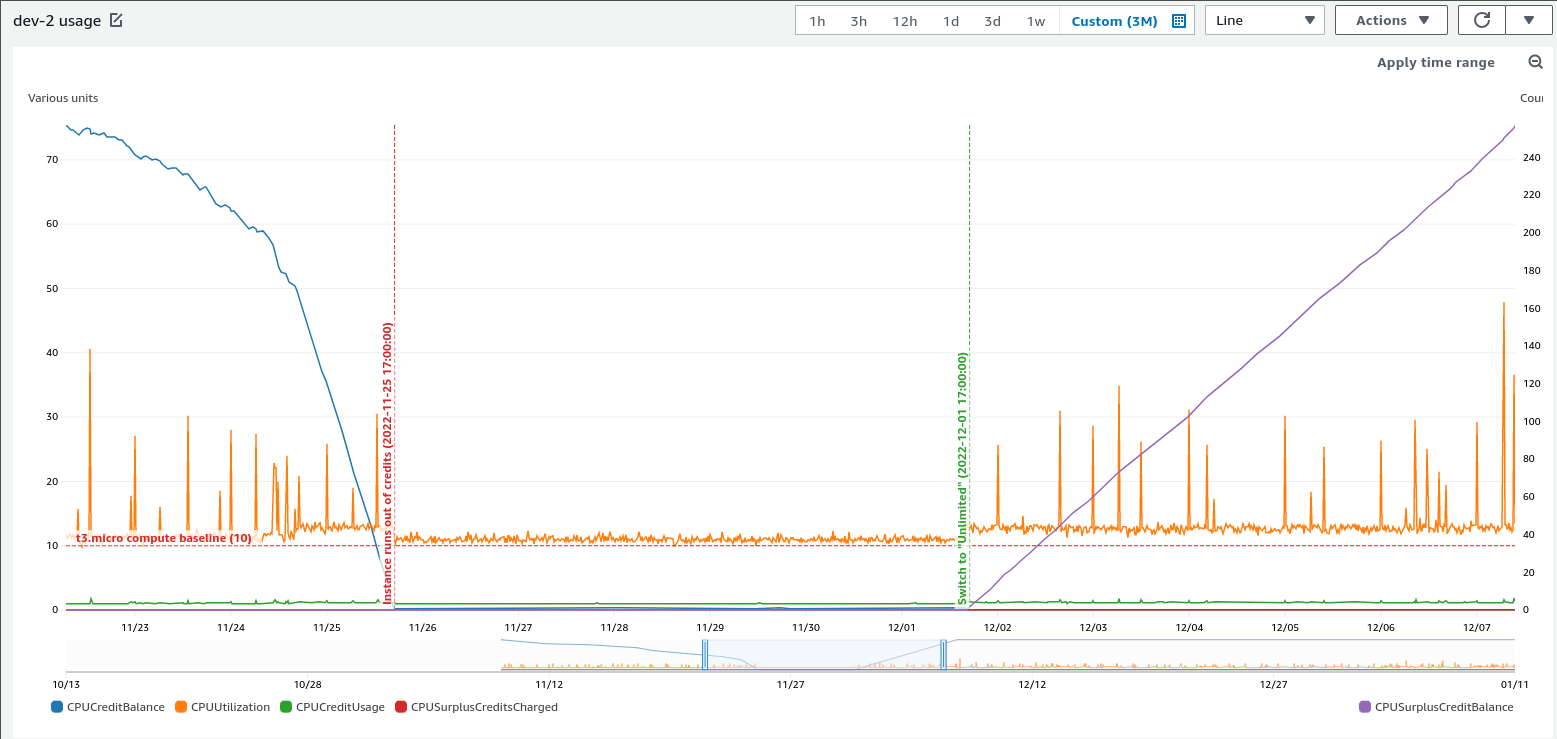
Here are some CloudWatch metrics detailing CPU credits balance across all of our burst-capable Development EC2s at the time:
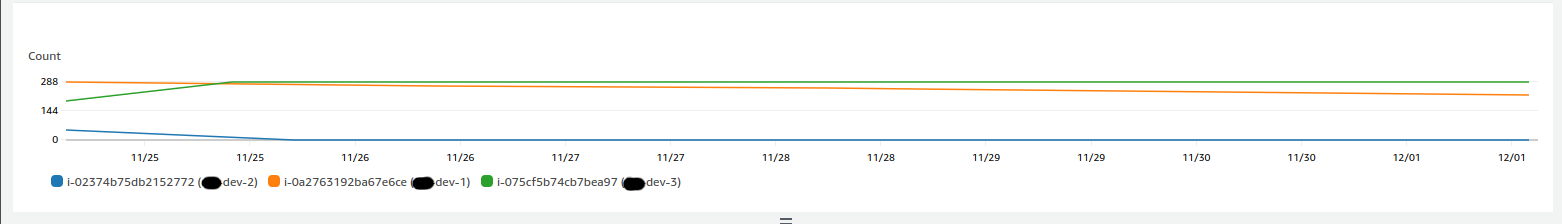
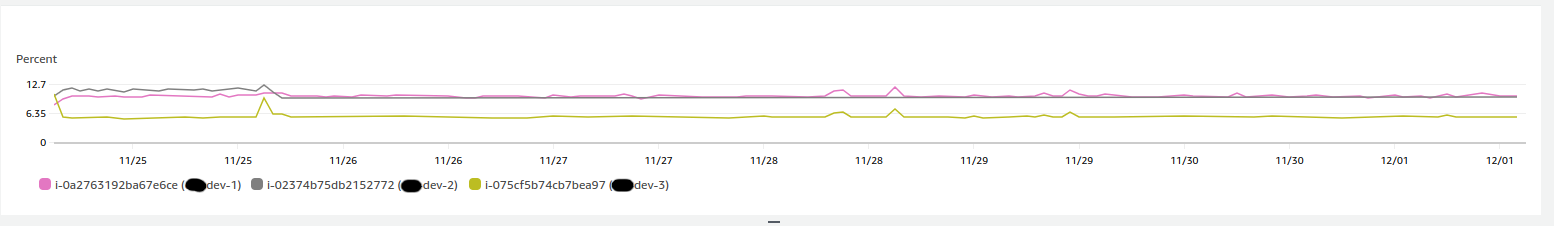
The two graphs above depict an EC2 instance on a Standard credit specification, running out of credits and being throttled as a result. These graphs established the direct link between the CPU resource starvation alerts we had been regularly seeing in dev-2. At this stage, the remaining balance for dev-2 was nearly 0. It didn’t accrue any credits as it rarely remained under its baseline 10% CPU utilisation target.
Solving this problem was far easier for us than identifying it, as all we had to do was flip the credit specification of dev-2 to Unlimited. This is something you can do on a running EC2 instance. We might incur slightly higher EC2 costs as a result of doing this if we expect the baseline to be surpassed regularly but we found it was worth it as the price difference was negligible in a tiny compute cluster of t3.micro instances.
Even more so than the cost of our Development environment bill, we were concerned about the possibility that our Production EC2s were subject to the same limitation, as they are also t3.micro. Fortunately, this was not the case. The default credit specification for new burstable EC2 instances for our account/region combination had been previously configured to be Unlimited. dev-2 might have been set up during a time when the default account-wide setting was Standard.
Conclusions
One of the most surprising things I learned from this was how conservative the EC2 burstable CPU capacity baselines are and how easy it is to breach them if you’re not careful. This was something that had been pretty far down in my list of potential reasons why an EC2 could misbehave up to this point.
Provisioning burstable EC2 instances on a Standard credit specification is the cheapest way to run EC2 on-demand instances but it is important to familiarise ourselves with the intricate rules that underpin its billing mechanism to avoid wasting time troubleshooting easily preventable resource saturation issues in the cloud.
Regular performance testing and routine monitoring of our services help us develop a mental model of what normal usage looks like in our systems. This allows us to plan for capacity and minimise costs by ensuring our infrastructure can operate smoothly without breaching vendor-imposed restrictions.